获取系统相关信息的命令集。
Section 6.1: CPU、内存、网络、磁盘(I/O操作)统计
要获得有关Linux主要组件的一般统计信息,使用一系列带有 stat 的命令是非常实用的,下面的例子为在fedora 41 版本下执行,需要安装 sysstat 软件包,命令为sudo dnf install -y sysstat
CPU
要获得处理器相关的统计信息,你可以使用mpstat命令,通过一些常用的选项,它将提供更好的可见性:
# 不带任何参数选项,只输出一次
[demouser@vbox ~]$ mpstat
Linux 6.11.5-300.fc41.x86_64 (vbox)     2024年11月05日  _x86_64_        (4 CPU)

10时02分39秒  CPU    %usr   %nice    %sys %iowait    %irq   %soft  %steal  %guest  %gnice   %idle
10时02分39秒  all    1.98    0.04    1.60    8.70    3.83    0.87    0.00    0.00    0.00   82.98
# 下面命令中带有两个参数选项,第一个数字 2 代表两秒刷新一次;第二个数字 10 代表输出10次
[demouser@vbox ~]$ mpstat 2 10
Linux 6.11.5-300.fc41.x86_64 (vbox)     2024年11月05日  _x86_64_        (4 CPU)

10时02分47秒  CPU    %usr   %nice    %sys %iowait    %irq   %soft  %steal  %guest  %gnice   %idle
10时02分49秒  all    0.00    0.00    0.00    0.00    2.62    0.62    0.00    0.00    0.00   96.75
10时02分51秒  all    0.12    0.00    0.00    0.00    2.38    0.62    0.00    0.00    0.00   96.88
10时02分53秒  all    0.00    0.00    0.13    0.00    2.38    0.63    0.00    0.00    0.00   96.87
10时02分55秒  all    0.12    0.00    0.00    0.00    2.37    0.75    0.00    0.00    0.00   96.75
10时02分57秒  all    0.00    0.00    0.25    0.00    2.50    0.62    0.00    0.00    0.00   96.63
10时02分59秒  all    0.00    0.00    0.12    0.00    2.25    0.50    0.00    0.00    0.00   97.13
10时03分01秒  all    0.00    0.00    0.13    0.00    2.51    0.63    0.00    0.00    0.00   96.74
10时03分03秒  all    0.00    0.00    0.13    0.00    2.50    0.75    0.00    0.00    0.00   96.62
10时03分05秒  all    0.00    0.00    0.62    3.00    3.12    0.62    0.00    0.00    0.00   92.62
10时03分07秒  all    0.25    0.00    0.12    0.00    2.37    0.62    0.00    0.00    0.00   96.64
平均时间:  all    0.05    0.00    0.15    0.30    2.50    0.64    0.00    0.00    0.00   96.36
Memory
我们都知道 free 命令可以显示(已经使用和剩余)内存的数量,但查看包括I/O操作在内的所有统计数据则需要使用vmstat命令:
# 不带参数选项
[demouser@vbox ~]$ vmstat
procs -----------memory---------- ---swap-- -----io---- -system-- -------cpu-------
 r  b   swpd   free   buff  cache   si   so    bi    bo   in   cs us sy id wa st gu
 1  0      0 470004   5720 1896472    0    0  1881   253 2915    2  2  6 84  8  0  0
# 带参数选项,2秒10次
[demouser@vbox ~]$ vmstat 2 10
procs -----------memory---------- ---swap-- -----io---- -system-- -------cpu-------
 r  b   swpd   free   buff  cache   si   so    bi    bo   in   cs us sy id wa st gu
 1  0      0 469708   5720 1896664    0    0  1861   252 2910    2  2  6 84  8  0  0
 0  0      0 469752   5720 1896756    0    0     0     0 2604  148  0  3 97  0  0  0
 0  0      0 469752   5720 1896756    0    0     0     0 2446  112  0  3 97  0  0  0
 0  0      0 469752   5720 1896756    0    0     0     0 2487   94  0  3 97  0  0  0
 0  0      0 469752   5720 1896756    0    0     0     0 2406  145  0  4 96  0  0  0
 0  0      0 469752   5720 1896756    0    0     0     0 2344   99  0  3 97  0  0  0
 0  0      0 469752   5720 1896756    0    0     0     0 2534  138  0  3 97  0  0  0
 0  0      0 469752   5720 1896756    0    0     0     0 2443   86  0  3 97  0  0  0
 0  0      0 469752   5720 1896756    0    0     0     0 2489   97  0  3 97  0  0  0
 0  0      0 469752   5720 1896756    0    0     0     0 2548  137  0  3 97  0  0  0
Disk
要实时获取有关磁盘操作的一般信息,可以利用iostat。
# 不带参数选项
[demouser@vbox ~]$ iostat
Linux 6.11.5-300.fc41.x86_64 (vbox)     2024年11月05日  _x86_64_        (4 CPU)

avg-cpu:  %user   %nice %system %iowait  %steal   %idle
           1.62    0.04    5.74    7.14    0.00   85.46

Device             tps    kB_read/s    kB_wrtn/s    kB_dscd/s    kB_read    kB_wrtn    kB_dscd
sda              40.36      1684.19       230.83         0.00    1123256     153953          0
zram0             0.08         1.77         0.01         0.00       1180          4          0
# 带参数选项,2秒5次
[demouser@vbox ~]$ iostat -kx 2 5
Linux 6.11.5-300.fc41.x86_64 (vbox)     2024年11月05日  _x86_64_        (4 CPU)

avg-cpu:  %user   %nice %system %iowait  %steal   %idle
           1.44    0.03    5.48    6.36    0.00   86.68

Device            r/s     rkB/s   rrqm/s  %rrqm r_await rareq-sz     w/s     wkB/s   wrqm/s  %wrqm w_await wareq-sz     d/s     dkB/s   drqm/s  %drqm d_await dareq-sz     f/s f_await  aqu-sz  %util
sda             25.35   1502.46    11.16  30.56   28.37    59.26   10.74    208.33     6.48  37.64   10.73    19.40    0.00      0.00     0.00   0.00    0.00     0.00    0.95   12.54    0.85  16.70
zram0            0.07      1.58     0.00   0.00    0.00    21.85    0.00      0.01     0.00   0.00    0.00     4.00    0.00      0.00     0.00   0.00    0.00     0.00    0.00    0.00    0.00   0.00


avg-cpu:  %user   %nice %system %iowait  %steal   %idle
           0.00    0.00    3.38    0.00    0.00   96.62

Device            r/s     rkB/s   rrqm/s  %rrqm r_await rareq-sz     w/s     wkB/s   wrqm/s  %wrqm w_await wareq-sz     d/s     dkB/s   drqm/s  %drqm d_await dareq-sz     f/s f_await  aqu-sz  %util
sda              0.00      0.00     0.00   0.00    0.00     0.00    0.00      0.00     0.00   0.00    0.00     0.00    0.00      0.00     0.00   0.00    0.00     0.00    0.00    0.00    0.00   0.00
zram0            0.00      0.00     0.00   0.00    0.00     0.00    0.00      0.00     0.00   0.00    0.00     0.00    0.00      0.00     0.00   0.00    0.00     0.00    0.00    0.00    0.00   0.00


avg-cpu:  %user   %nice %system %iowait  %steal   %idle
           0.00    0.00    3.38    0.00    0.00   96.62

Device            r/s     rkB/s   rrqm/s  %rrqm r_await rareq-sz     w/s     wkB/s   wrqm/s  %wrqm w_await wareq-sz     d/s     dkB/s   drqm/s  %drqm d_await dareq-sz     f/s f_await  aqu-sz  %util
sda              0.00      0.00     0.00   0.00    0.00     0.00    0.00      0.00     0.00   0.00    0.00     0.00    0.00      0.00     0.00   0.00    0.00     0.00    0.00    0.00    0.00   0.00
zram0            0.00      0.00     0.00   0.00    0.00     0.00    0.00      0.00     0.00   0.00    0.00     0.00    0.00      0.00     0.00   0.00    0.00     0.00    0.00    0.00    0.00   0.00


avg-cpu:  %user   %nice %system %iowait  %steal   %idle
           0.00    0.00    2.88    0.00    0.00   97.12

Device            r/s     rkB/s   rrqm/s  %rrqm r_await rareq-sz     w/s     wkB/s   wrqm/s  %wrqm w_await wareq-sz     d/s     dkB/s   drqm/s  %drqm d_await dareq-sz     f/s f_await  aqu-sz  %util
sda              0.00      0.00     0.00   0.00    0.00     0.00    0.00      0.00     0.00   0.00    0.00     0.00    0.00      0.00     0.00   0.00    0.00     0.00    0.00    0.00    0.00   0.00
zram0            0.00      0.00     0.00   0.00    0.00     0.00    0.00      0.00     0.00   0.00    0.00     0.00    0.00      0.00     0.00   0.00    0.00     0.00    0.00    0.00    0.00   0.00


avg-cpu:  %user   %nice %system %iowait  %steal   %idle
           0.12    0.00    3.62    0.00    0.00   96.25

Device            r/s     rkB/s   rrqm/s  %rrqm r_await rareq-sz     w/s     wkB/s   wrqm/s  %wrqm w_await wareq-sz     d/s     dkB/s   drqm/s  %drqm d_await dareq-sz     f/s f_await  aqu-sz  %util
sda              0.00      0.00     0.00   0.00    0.00     0.00    0.00      0.00     0.00   0.00    0.00     0.00    0.00      0.00     0.00   0.00    0.00     0.00    0.00    0.00    0.00   0.00
zram0            0.00      0.00     0.00   0.00    0.00     0.00    0.00      0.00     0.00   0.00    0.00     0.00    0.00      0.00     0.00   0.00    0.00     0.00    0.00    0.00    0.00   0.00
Network
为了能够看到你的网络服务正在发生监听什么端口,和谁建立了链接,你可以使用 netstat 命令。
# 查看统计 TCP sockets
[demouser@vbox ~]$ netstat -ntlp
(Not all processes could be identified, non-owned process info
 will not be shown, you would have to be root to see it all.)
Active Internet connections (only servers)
Proto Recv-Q Send-Q Local Address           Foreign Address         State       PID/Program name
tcp        0      0 0.0.0.0:5355            0.0.0.0:*               LISTEN      -
tcp        0      0 127.0.0.54:53           0.0.0.0:*               LISTEN      -
tcp        0      0 127.0.0.53:53           0.0.0.0:*               LISTEN      -
tcp        0      0 0.0.0.0:22              0.0.0.0:*               LISTEN      -
tcp        0      0 0.0.0.0:27500           0.0.0.0:*               LISTEN      -
tcp        0      0 127.0.0.1:631           0.0.0.0:*               LISTEN      -
tcp6       0      0 :::5355                 :::*                    LISTEN      -
tcp6       0      0 :::22                   :::*                    LISTEN      -
tcp6       0      0 ::1:631                 :::*                    LISTEN      -

# 查看统计 UDP sockets
[demouser@vbox ~]$ netstat -nulp
(Not all processes could be identified, non-owned process info
 will not be shown, you would have to be root to see it all.)
Active Internet connections (only servers)
Proto Recv-Q Send-Q Local Address           Foreign Address         State       PID/Program name
udp        0      0 0.0.0.0:43704           0.0.0.0:*                           -
udp        0      0 0.0.0.0:5353            0.0.0.0:*                           -
udp        0      0 0.0.0.0:5355            0.0.0.0:*                           -
udp        0      0 127.0.0.54:53           0.0.0.0:*                           -
udp        0      0 127.0.0.53:53           0.0.0.0:*                           -
udp        0      0 127.0.0.1:323           0.0.0.0:*                           -
udp6       0      0 :::5353                 :::*                                -
udp6       0      0 :::5355                 :::*                                -
udp6       0      0 :::47023                :::*                                -
udp6       0      0 ::1:323                 :::*                                -

# 查看统计 Unix sockets
[demouser@vbox ~]$ netstat -nxlp
(Not all processes could be identified, non-owned process info
 will not be shown, you would have to be root to see it all.)
Active UNIX domain sockets (only servers)
Proto RefCnt Flags       Type       State         I-Node   PID/Program name     Path
unix  2      [ ACC ]     STREAM     LISTENING     8790     -                    /var/run/mcelog-client
unix  2      [ ACC ]     STREAM     LISTENING     9684     -                    /tmp/.iprt-localipc-DRMIpcServer
unix  2      [ ACC ]     STREAM     LISTENING     4057     -                    /run/systemd/userdb/io.systemd.DynamicUser
unix  2      [ ACC ]     STREAM     LISTENING     4058     -                    /run/systemd/io.systemd.ManagedOOM
unix  2      [ ACC ]     STREAM     LISTENING     8916     -                    /run/systemd/userdb/io.systemd.Machine
unix  2      [ ACC ]     STREAM     LISTENING     4069     -                    /run/systemd/journal/stdout
unix  2      [ ACC ]     STREAM     LISTENING     8917     -                    /run/systemd/machine/io.systemd.Machine

…… 略 ……

unix  2      [ ACC ]     STREAM     LISTENING     20524    2012/gnome-session-  @/tmp/.ICE-unix/2012
unix  2      [ ACC ]     STREAM     LISTENING     20661    2509/Xwayland        @/tmp/.X11-unix/X0
unix  2      [ ACC ]     STREAM     LISTENING     20663    2509/Xwayland        @/tmp/.X11-unix/X1
unix  2      [ ACC ]     STREAM     LISTENING     9508     -                    @ISCSID_UIP_ABSTRACT_NAMESPACE
unix  2      [ ACC ]     STREAM     LISTENING     9507     -                    @ISCSIADM_ABSTRACT_NAMESPACE
当然你也可以找到一些其他有用的实时网络流量监控工具,例如 iftop(需要安装):
$ sudo iftop
其他可选
要实时生成与所有组件的I/O操作相关的统计数据,可以使用dstat(需要安装)。该工具是vmstat、iostat和ifstat的通用替代品。
[demouser@vbox ~]$ dstat 2 10
You did not select any stats, using -cdngy by default.
----total-usage---- -dsk/total- -net/total- ---paging-- ---system--
usr sys idl wai stl| read  writ| recv  send|  in   out | int   csw
  3   0  96   0   0|   0     0 | 184B  543B|   0     0 |2405   112
  3   0  96   0   0|   0     0 | 184B  400B|   0     0 |2383   131
  4   0  96   0   0|   0     0 | 184B  400B|   0     0 |2331   170
  3   0  97   0   0|   0     0 | 184B  400B|   0     0 |2506   113
  3   0  97   0   0|   0     0 | 184B  400B|   0     0 |2480   161
  4   0  94   2   0|   0   708k| 184B  400B|   0     0 |2230   120
  4   0  96   0   0|   0     0 | 184B  400B|   0     0 |2386   131
  3   0  96   0   0|   0     0 | 184B  400B|   0     0 |2398   142
  3   0  96   0   0|   0     0 | 184B  400B|   0     0 |2408   109
  4   0  96   0   0|   0     0 | 214B  400B|   0     0 |2342   150
Section 6.2: 使用lscpu和lshw等工具
一种简单获取CPU信息的方法就是通过使用像 lscpu 这样的工具。
demouser@demohosts:~$ lscpu
架构:                    x86_64
  CPU 运行模式:          32-bit, 64-bit
  Address sizes:          43 bits physical, 48 bits virtual
  字节序:                Little Endian
CPU:                      4
  在线 CPU 列表:         0-3
厂商 ID:                 GenuineIntel
  型号名称:              Intel(R) Core(TM) i5-2400 CPU @ 3.10GHz
    CPU 系列:            6
    型号:                42
    每个核的线程数:      1
    每个座的核数:        1
    座:                  4
    步进:                7
    BogoMIPS:            6185.94
    标记:                fpu vme de pse tsc msr pae mce cx8 apic sep mtrr pge mca cmov pat pse36 clflu
                          sh mmx fxsr sse sse2 syscall nx rdtscp lm constant_tsc arch_perfmon nopl xtop
                          ology tsc_reliable nonstop_tsc cpuid tsc_known_freq pni pclmulqdq vmx ssse3 c
                          x16 pcid sse4_1 sse4_2 x2apic popcnt tsc_deadline_timer aes xsave avx hypervi
                          sor lahf_lm pti ssbd ibrs ibpb stibp tpr_shadow ept vpid tsc_adjust arat vnmi
                           md_clear flush_l1d arch_capabilities
Virtualization features:
  虚拟化:                VT-x
  超管理器厂商:          VMware
  虚拟化类型:            完全
Caches (sum of all):
  L1d:                    128 KiB (4 instances)
  L1i:                    128 KiB (4 instances)
  L2:                     1 MiB (4 instances)
  L3:                     24 MiB (4 instances)
NUMA:
  NUMA 节点:             1
  NUMA 节点0 CPU:        0-3
Vulnerabilities:
  Gather data sampling:   Not affected
  Itlb multihit:          KVM: Mitigation: VMX disabled
  L1tf:                   Mitigation; PTE Inversion; VMX flush not necessary, SMT disabled
  Mds:                    Mitigation; Clear CPU buffers; SMT Host state unknown
  Meltdown:               Mitigation; PTI
  Mmio stale data:        Unknown: No mitigations
  Reg file data sampling: Not affected
  Retbleed:               Mitigation; IBRS
  Spec rstack overflow:   Not affected
  Spec store bypass:      Mitigation; Speculative Store Bypass disabled via prctl
  Spectre v1:             Mitigation; usercopy/swapgs barriers and __user pointer sanitization
  Spectre v2:             Mitigation; IBRS; IBPB conditional; STIBP disabled; RSB filling; PBRSB-eIBRS
                          Not affected; BHI SW loop, KVM SW loop
  Srbds:                  Not affected
  Tsx async abort:        Not affected
或者通过使用 lshw 工具再加上管道筛选
demouser@demohosts:~$ lshw | grep cpu
WARNING: you should run this program as super-user.
     *-cpu:0
          bus info: cpu@0
          capabilities: fpu fpu_exception wp vme de pse tsc msr pae mce cx8 apic sep mtrr pge mca cmov pat pse36 clflush mmx fxsr sse sse2 syscall nx rdtscp x86-64 constant_tsc arch_perfmon nopl xtopology tsc_reliable nonstop_tsc cpuid tsc_known_freq pni pclmulqdq vmx ssse3 cx16 pcid sse4_1 sse4_2 x2apic popcnt tsc_deadline_timer aes xsave avx hypervisor lahf_lm pti ssbd ibrs ibpb stibp tpr_shadow ept vpid tsc_adjust arat vnmi md_clear flush_l1d arch_capabilities
     *-cpu:1
          bus info: cpu@1
          capabilities: fpu fpu_exception wp vme de pse tsc msr pae mce cx8 apic sep mtrr pge mca cmov pat pse36 clflush mmx fxsr sse sse2 syscall nx rdtscp x86-64 constant_tsc arch_perfmon nopl xtopology tsc_reliable nonstop_tsc cpuid tsc_known_freq pni pclmulqdq vmx ssse3 cx16 pcid sse4_1 sse4_2 x2apic popcnt tsc_deadline_timer aes xsave avx hypervisor lahf_lm pti ssbd ibrs ibpb stibp tpr_shadow ept vpid tsc_adjust arat vnmi md_clear flush_l1d arch_capabilities
     *-cpu:2
          bus info: cpu@2
          capabilities: fpu fpu_exception wp vme de pse tsc msr pae mce cx8 apic sep mtrr pge mca cmov pat pse36 clflush mmx fxsr sse sse2 syscall nx rdtscp x86-64 constant_tsc arch_perfmon nopl xtopology tsc_reliable nonstop_tsc cpuid tsc_known_freq pni pclmulqdq vmx ssse3 cx16 pcid sse4_1 sse4_2 x2apic popcnt tsc_deadline_timer aes xsave avx hypervisor lahf_lm pti ssbd ibrs ibpb stibp tpr_shadow ept vpid tsc_adjust arat vnmi md_clear flush_l1d arch_capabilities
     *-cpu:3
          bus info: cpu@3
          capabilities: fpu fpu_exception wp vme de pse tsc msr pae mce cx8 apic sep mtrr pge mca cmov pat pse36 clflush mmx fxsr sse sse2 syscall nx rdtscp x86-64 constant_tsc arch_perfmon nopl xtopology tsc_reliable nonstop_tsc cpuid tsc_known_freq pni pclmulqdq vmx ssse3 cx16 pcid sse4_1 sse4_2 x2apic popcnt tsc_deadline_timer aes xsave avx hypervisor lahf_lm pti ssbd ibrs ibpb stibp tpr_shadow ept vpid tsc_adjust arat vnmi md_clear flush_l1d arch_capabilities
WARNING: output may be incomplete or inaccurate, you should run this program as super-user.
Section 6.3: 列出硬件信息
上面提到的 lshw 是一个小工具,用于提取机器硬件配置的详细信息。它可以报告准确的内存配置、固件版本、主板配置、CPU版本和速度、缓存配置、总线速度等硬件信息。同时可以将信息导出为文件。
$ sudo lshw | less (or more)
$ sudo lshw -html > myhardware.html
$ sudo lshw -xml > myhardware.xml
显示PCI信息
# 不带参数选项
demouser@demohosts:~$ lspci
00:00.0 Host bridge: Intel Corporation 440BX/ZX/DX - 82443BX/ZX/DX Host bridge (rev 01)
00:01.0 PCI bridge: Intel Corporation 440BX/ZX/DX - 82443BX/ZX/DX AGP bridge (rev 01)
00:07.0 ISA bridge: Intel Corporation 82371AB/EB/MB PIIX4 ISA (rev 08)
00:07.1 IDE interface: Intel Corporation 82371AB/EB/MB PIIX4 IDE (rev 01)
00:07.3 Bridge: Intel Corporation 82371AB/EB/MB PIIX4 ACPI (rev 08)
00:07.7 System peripheral: VMware Virtual Machine Communication Interface (rev 10)
00:0f.0 VGA compatible controller: VMware SVGA II Adapter
00:10.0 SCSI storage controller: Broadcom / LSI

…… 略 ……

02:00.0 USB controller: VMware USB1.1 UHCI Controller
02:01.0 USB controller: VMware USB2 EHCI Controller
02:03.0 SATA controller: VMware SATA AHCI controller
03:00.0 Ethernet controller: VMware VMXNET3 Ethernet Controller (rev 01)

# 带参数选项
demouser@demohosts:~$ lspci -tv
-[0000:00]-+-00.0  Intel Corporation 440BX/ZX/DX - 82443BX/ZX/DX Host bridge
           +-01.0-[01]--
           +-07.0  Intel Corporation 82371AB/EB/MB PIIX4 ISA
           +-07.1  Intel Corporation 82371AB/EB/MB PIIX4 IDE
           +-07.3  Intel Corporation 82371AB/EB/MB PIIX4 ACPI
           +-07.7  VMware Virtual Machine Communication Interface
           +-0f.0  VMware SVGA II Adapter
           +-10.0  Broadcom / LSI 53c1030 PCI-X Fusion-MPT Dual Ultra320 SCSI
           +-11.0-[02]--+-00.0  VMware USB1.1 UHCI Controller
           |            +-01.0  VMware USB2 EHCI Controller
           |            \-03.0  VMware SATA AHCI controller
           +-15.0-[03]----00.0  VMware VMXNET3 Ethernet Controller
           +-15.1-[04]--
…… 略 ……
显示USB信息
demouser@demohosts:~$ lsusb
Bus 001 Device 001: ID 1d6b:0001 Linux Foundation 1.1 root hub
Bus 001 Device 002: ID 0e0f:0003 VMware, Inc. Virtual Mouse
Bus 001 Device 003: ID 0e0f:0002 VMware, Inc. Virtual USB Hub
Bus 002 Device 001: ID 1d6b:0002 Linux Foundation 2.0 root hub
demouser@demohosts:~$ lsusb -tv
/:  Bus 001.Port 001: Dev 001, Class=root_hub, Driver=uhci_hcd/2p, 12M
    ID 1d6b:0001 Linux Foundation 1.1 root hub
    |__ Port 001: Dev 002, If 0, Class=Human Interface Device, Driver=usbhid, 12M
        ID 0e0f:0003 VMware, Inc. Virtual Mouse
    |__ Port 002: Dev 003, If 0, Class=Hub, Driver=hub/7p, 12M
        ID 0e0f:0002 VMware, Inc. Virtual USB Hub
/:  Bus 002.Port 001: Dev 001, Class=root_hub, Driver=ehci-pci/6p, 480M
    ID 1d6b:0002 Linux Foundation 2.0 root hub
显示BIOS信息,输出的内容太多,建议用less或者more分页显示,或者重定向到一个文件中再慢慢的看。
$ sudo dmidecode -q | less
要查看磁盘的具体信息(以硬盘sda为例),可以使用:
[demouser@vbox ~]$ sudo hdparm -i /dev/sda

/dev/sda:

 Model=VBOX HARDDISK, FwRev=1.0, SerialNo=VB8e46079e-ad557b23
 Config={ Fixed }
 RawCHS=16383/16/63, TrkSize=0, SectSize=512, ECCbytes=0
 BuffType=DualPortCache, BuffSize=256kB, MaxMultSect=128, MultSect=128
 CurCHS=16383/16/63, CurSects=16514064, LBA=yes, LBAsects=134217728
 IORDY=yes, tPIO={min:120,w/IORDY:120}, tDMA={min:120,rec:120}
 PIO modes:  pio0 pio3 pio4
 DMA modes:  mdma0 mdma1 mdma2
 UDMA modes: udma0 udma1 udma2 udma3 udma4 udma5 *udma6
 AdvancedPM=no WriteCache=enabled
 Drive conforms to: unknown:  ATA/ATAPI-1,2,3,4,5,6

 * signifies the current active mode
一些额外的工具/命令将帮助收集一些额外的信息:
$ smartctl -A /dev/sda | grep Power_On_Hours # 这个磁盘(系统)总共上电多长时间
$ hdparm -tT /dev/sda # 在磁盘sda上做读取速度测试
$ badblocks -s /dev/sda # 在磁盘sda上测试不可读的块
Section 6.4: 查找 CPU 的 model/频率 等硬件信息
$ cat /proc/cpuinfo
输出结果:
demouser@demohosts:~$ cat /proc/cpuinfo
processor       : 0
vendor_id       : GenuineIntel
cpu family      : 6
model           : 42
model name      : Intel(R) Core(TM) i5-2400 CPU @ 3.10GHz
stepping        : 7
microcode       : 0x2f
cpu MHz         : 3092.974
cache size      : 6144 KB
physical id     : 0
siblings        : 1
core id         : 0
cpu cores       : 1
apicid          : 0
initial apicid  : 0
fpu             : yes
fpu_exception   : yes
cpuid level     : 13
wp              : yes
flags           : fpu vme de pse tsc msr pae mce cx8 apic sep mtrr pge mca cmov pat pse36 clflush mmx fxsr sse sse2 syscall nx rdtscp lm constant_tsc arch_perfmon nopl xtopology tsc_reliable nonstop_tsc cpuid tsc_known_freq pni pclmulqdq vmx ssse3 cx16 pcid sse4_1 sse4_2 x2apic popcnt tsc_deadline_timer aes xsave avx hypervisor lahf_lm pti ssbd ibrs ibpb stibp tpr_shadow ept vpid tsc_adjust arat vnmi md_clear flush_l1d arch_capabilities
vmx flags       : vnmi invvpid ept_x_only tsc_offset vtpr mtf ept vpid unrestricted_guest
bugs            : cpu_meltdown spectre_v1 spectre_v2 spec_store_bypass l1tf mds swapgs itlb_multihit mmio_unknown retbleed bhi
bogomips        : 6185.94
clflush size    : 64
cache_alignment : 64
address sizes   : 43 bits physical, 48 bits virtual
power management:

…… 略 ……

processor       : 3
vendor_id       : GenuineIntel
cpu family      : 6
model           : 42
model name      : Intel(R) Core(TM) i5-2400 CPU @ 3.10GHz
stepping        : 7
microcode       : 0x2f
cpu MHz         : 3092.974
cache size      : 6144 KB
physical id     : 6
siblings        : 1
core id         : 0
cpu cores       : 1
apicid          : 6
initial apicid  : 6
fpu             : yes
fpu_exception   : yes
cpuid level     : 13
wp              : yes
flags           : fpu vme de pse tsc msr pae mce cx8 apic sep mtrr pge mca cmov pat pse36 clflush mmx fxsr sse sse2 syscall nx rdtscp lm constant_tsc arch_perfmon nopl xtopology tsc_reliable nonstop_tsc cpuid tsc_known_freq pni pclmulqdq vmx ssse3 cx16 pcid sse4_1 sse4_2 x2apic popcnt tsc_deadline_timer aes xsave avx hypervisor lahf_lm pti ssbd ibrs ibpb stibp tpr_shadow ept vpid tsc_adjust arat vnmi md_clear flush_l1d arch_capabilities
vmx flags       : vnmi invvpid ept_x_only tsc_offset vtpr mtf ept vpid unrestricted_guest
bugs            : cpu_meltdown spectre_v1 spectre_v2 spec_store_bypass l1tf mds swapgs itlb_multihit mmio_unknown retbleed bhi
bogomips        : 6185.94
clflush size    : 64
cache_alignment : 64
address sizes   : 43 bits physical, 48 bits virtual
power management:
count processor (including cores):
统计CPU有多少核,可以使用下面的命令
demouser@demohosts:~$ grep -c processor /proc/cpuinfo
4
Section 6.5: 进程监控和信息收集
通常情况下,用来监视linux主机上正在运行的进程的方法分为两种:一种是静态监控;另一种则是动态监控
静态监控
在静态剪口中使用最广泛的命令是 ps命令(ps是process status的简写),用于提供有关当前运行进程的信息,包括进程id号(pid)等信息。
下面是一些通过常用选项来收集特定信息的例子:
1、按层次列出进程
demouser@demohosts:~$ ps -e -o pid,args --forest
    PID COMMAND
      2 [kthreadd]
      3  \_ [pool_workqueue_release]
      4  \_ [kworker/R-rcu_g]
      5  \_ [kworker/R-rcu_p]
      6  \_ [kworker/R-slub_]
      7  \_ [kworker/R-netns]
…… 略 ……
   7283  \_ [kworker/u10:4-events_power_efficient]
   7325  \_ [kworker/u9:1-events_power_efficient]
   7333  \_ [kworker/u11:1-events_unbound]
   7345  \_ [kworker/1:3-cgroup_destroy]
   7350  \_ [kworker/u10:0-events_unbound]
   7370  \_ [kworker/u12:3-events_power_efficient]
   7375  \_ [kworker/u9:2-events_unbound]
   7379  \_ [kworker/2:0]
   7380  \_ [kworker/2:2-cgroup_destroy]
      1 /sbin/init splash
    398 /usr/lib/systemd/systemd-journald
    435 /usr/lib/systemd/systemd-udevd
    671 /usr/lib/systemd/systemd-oomd
    676 /usr/lib/systemd/systemd-resolved
    679 /usr/lib/systemd/systemd-timesyncd
    734 avahi-daemon: running [demohosts.local]
    800  \_ avahi-daemon: chroot helper
…… 略 ……
按cpu使用率%排序列出进程
demouser@demohosts:~$ ps -e -o pcpu,cpu,nice,state,cputime,args --sort pcpu | sed '/^ 0.0 /d'
%CPU CPU  NI S     TIME COMMAND
 0.1   -   0 S 00:01:32 /usr/bin/containerd
 0.1   -   0 S 00:02:22 /usr/bin/gnome-shell
按mem (KB)使用情况排序的进程列表。
demouser@demohosts:~$ ps -e -orss=,args= | sort -b -k1,1n | pr -TW$COLUMNS
 0 [cpuhp/0]
 0 [cpuhp/1]
 0 [cpuhp/2]
 0 [cpuhp/3]
…… 略 ……
28292 /usr/bin/update-notifier
28844 /usr/libexec/ibus-extension-gtk3
30740 /snap/snapd-desktop-integration/253/usr/bin/snapd-desktop-integration
34932 /usr/lib/snapd/snapd
36460 /usr/libexec/evolution-addressbook-factory
40984 /usr/libexec/fwupd/fwupd
41648 /usr/libexec/xdg-desktop-portal-gnome
43648 /usr/libexec/evolution-source-registry
45024 /usr/bin/containerd
68552 /usr/libexec/evolution-data-server/evolution-alarm-notify
76888 /usr/bin/dockerd -H fd:// --containerd=/run/containerd/containerd.sock
350780 /usr/bin/gnome-shell
列出特定进程(例如 “sshd” 进程)的所有线程
demouser@demohosts:~$ ps -C sshd -L -o pid,tid,pcpu,state
    PID     TID %CPU S
   1244    1244  0.0 S
   7042    7042  0.0 S
   7127    7127  0.0 S
在找到特定的进程之后,您可以使用lsof收集与之相关的信息,以列出进程id已打开的路径
demouser@demohosts:~$ lsof -p $$
lsof: WARNING: can't stat() tracefs file system /sys/kernel/debug/tracing
      Output information may be incomplete.
COMMAND  PID     USER   FD   TYPE DEVICE SIZE/OFF    NODE NAME
bash    7129 demouser  cwd    DIR    8,2     4096 1050496 /home/demouser
bash    7129 demouser  rtd    DIR    8,2     4096       2 /
bash    7129 demouser  txt    REG    8,2  1446024  131629 /usr/bin/bash
bash    7129 demouser  mem    REG    8,2  5862016  170572 /usr/lib/locale/locale-archive
bash    7129 demouser  mem    REG    8,2  2125328  133532 /usr/lib/x86_64-linux-gnu/libc.so.6
bash    7129 demouser  mem    REG    8,2   208328  142962 /usr/lib/x86_64-linux-gnu/libtinfo.so.6.4
bash    7129 demouser  mem    REG    8,2    27028  133521 /usr/lib/x86_64-linux-gnu/gconv/gconv-modules.cache
bash    7129 demouser  mem    REG    8,2   236616  133529 /usr/lib/x86_64-linux-gnu/ld-linux-x86-64.so.2
bash    7129 demouser    0u   CHR  136,0      0t0       3 /dev/pts/0
bash    7129 demouser    1u   CHR  136,0      0t0       3 /dev/pts/0
bash    7129 demouser    2u   CHR  136,0      0t0       3 /dev/pts/0
bash    7129 demouser  255u   CHR  136,0      0t0       3 /dev/pts/0
Or based on path find out list processes that have specified path open
或基于路径找出已指定路径打开的进程列表
demouser@demohosts:~$ sudo lsof ~
lsof: WARNING: can't stat() fuse.portal file system /run/user/1000/doc
      Output information may be incomplete.
lsof: WARNING: can't stat() fuse.gvfsd-fuse file system /run/user/1000/gvfs
      Output information may be incomplete.
COMMAND    PID     USER   FD   TYPE DEVICE SIZE/OFF    NODE NAME
pipewire  1307 demouser  cwd    DIR    8,2     4096 1050496 /home/demouser
pipewire  1309 demouser  cwd    DIR    8,2     4096 1050496 /home/demouser
…… 略 ……
xdg-deskt 2548 demouser  cwd    DIR    8,2     4096 1050496 /home/demouser
xdg-deskt 2553 demouser  cwd    DIR    8,2     4096 1050496 /home/demouser
gvfsd-met 2555 demouser  cwd    DIR    8,2     4096 1050496 /home/demouser
xdg-deskt 2576 demouser  cwd    DIR    8,2     4096 1050496 /home/demouser
update-no 2630 demouser  cwd    DIR    8,2     4096 1050496 /home/demouser
sftp-serv 7128 demouser  cwd    DIR    8,2     4096 1050496 /home/demouser
bash      7129 demouser  cwd    DIR    8,2     4096 1050496 /home/demouser
sudo      7426     root  cwd    DIR    8,2     4096 1050496 /home/demouser
sudo      7427     root  cwd    DIR    8,2     4096 1050496 /home/demouser
lsof      7428     root  cwd    DIR    8,2     4096 1050496 /home/demouser
lsof      7429     root  cwd    DIR    8,2     4096 1050496 /home/demouser
动态监控
最常用的动态监控工具是 top 命令。top命令有大量的选项来过滤和实时表示信息(与ps命令相比)。
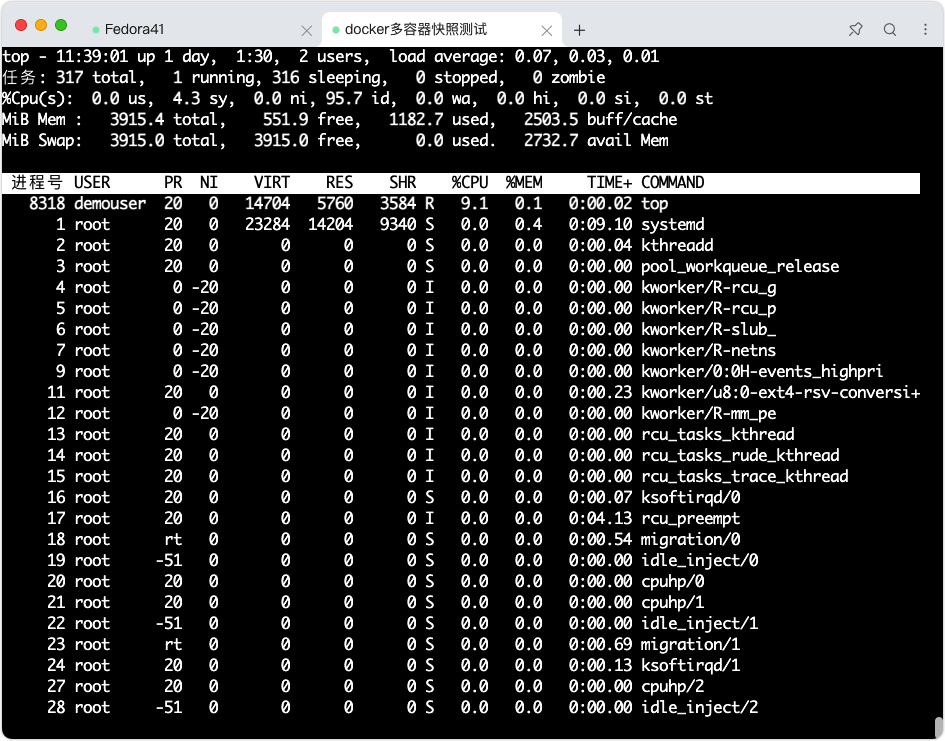
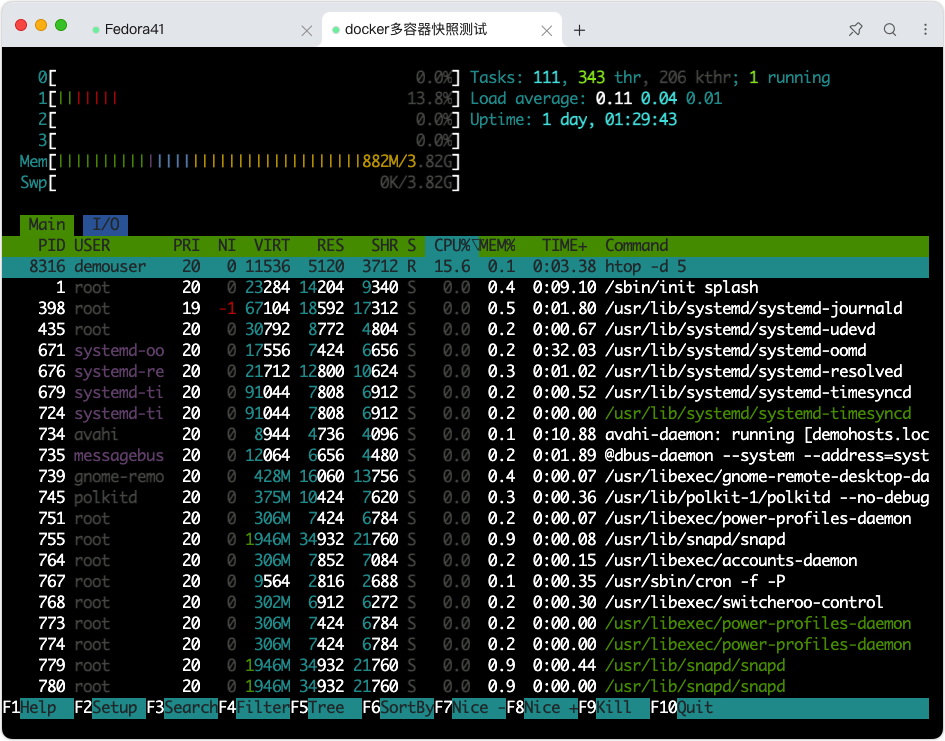
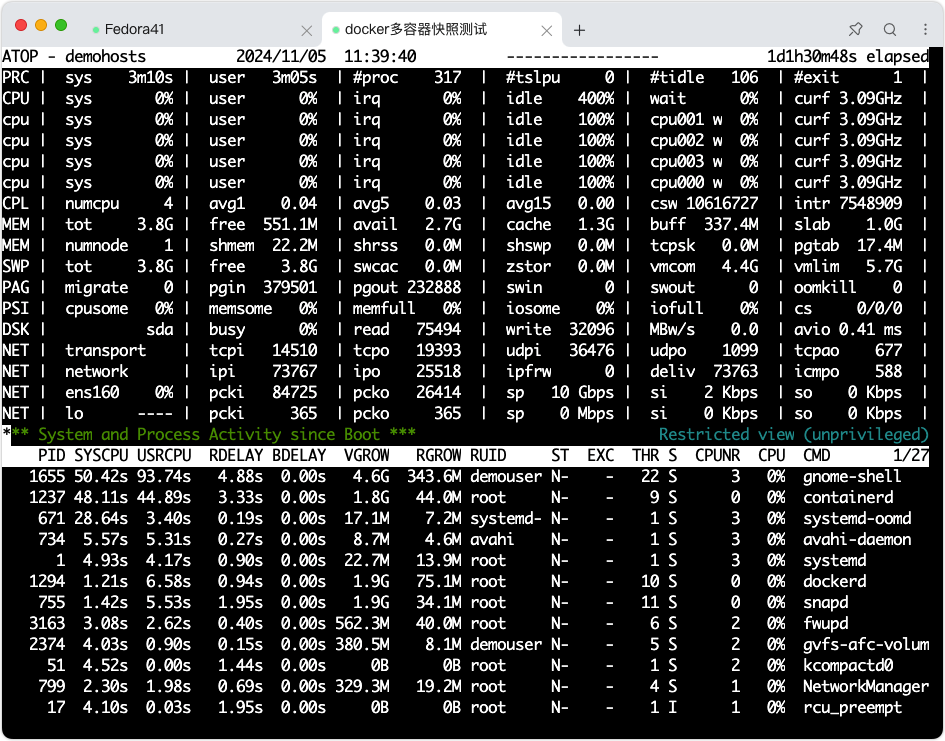
仍然有更多的其他选择的替代品可以考虑。如htop或者atop
$ htop -d 5
$ atop
$ sudo iotop
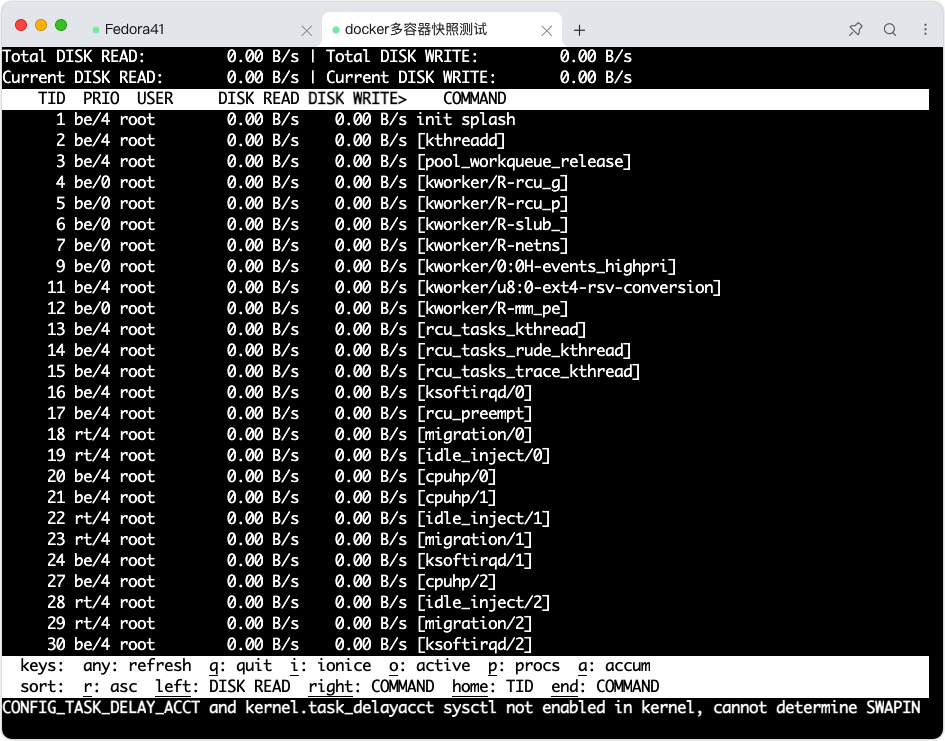
这些优秀的工具(如 iotop 或者 iftop )甚至有能力将所有的活动记录到日志文件中。